
Oscillators
Oscillators are trend recognizing analytical tool that constructs high and low bands between two extreme values. It builds a trend indicator that fluctuates within these bounds.
Traders use trend indicators to discover markets short-term overbought or oversold conditions.
It can be interpreted as overbought when the value of the oscillator approaches the upper extreme values and as oversold when it approaches lower extreme values.
Relative Strength Index (RSI)
RSI is probably the most common trend indicator used by traders that measures the momentum of trading instrument calculated in its closing prices. It is displayed as an oscillator ranging between 0 and 100. RSI calculation is usually based on 14 time periods with high values being 70 or above and low values being 30 or below.

We recognize following 4 RSI market conditions:
1. Oversold (<30)
The price of a trading instrument is below its fair value and may be ready for a trend reversal, on an RSI chart it appears at 30 or below
2. Extremely Oversold (<20)
It signals an extreme situation and we could expect the market to change trend to go back up to higher levels, we consider RSI to be extremely oversold below 20
3. Overbought (> 70)
The price of a trading instrument is above its fair value and may be ready for a trend reversal, on an RSI chart it appears at 70 or above
4. Extremely Overbought (>80)
It signals an extreme situation and we could expect the market to change trend to cool down, we consider RSI to be extremely overbought over 80
RSI Oversold
ZEUS will send you an alert describing market conditions.
The real example of Telegram message:
4h #ETH/USDT RSI Oversold
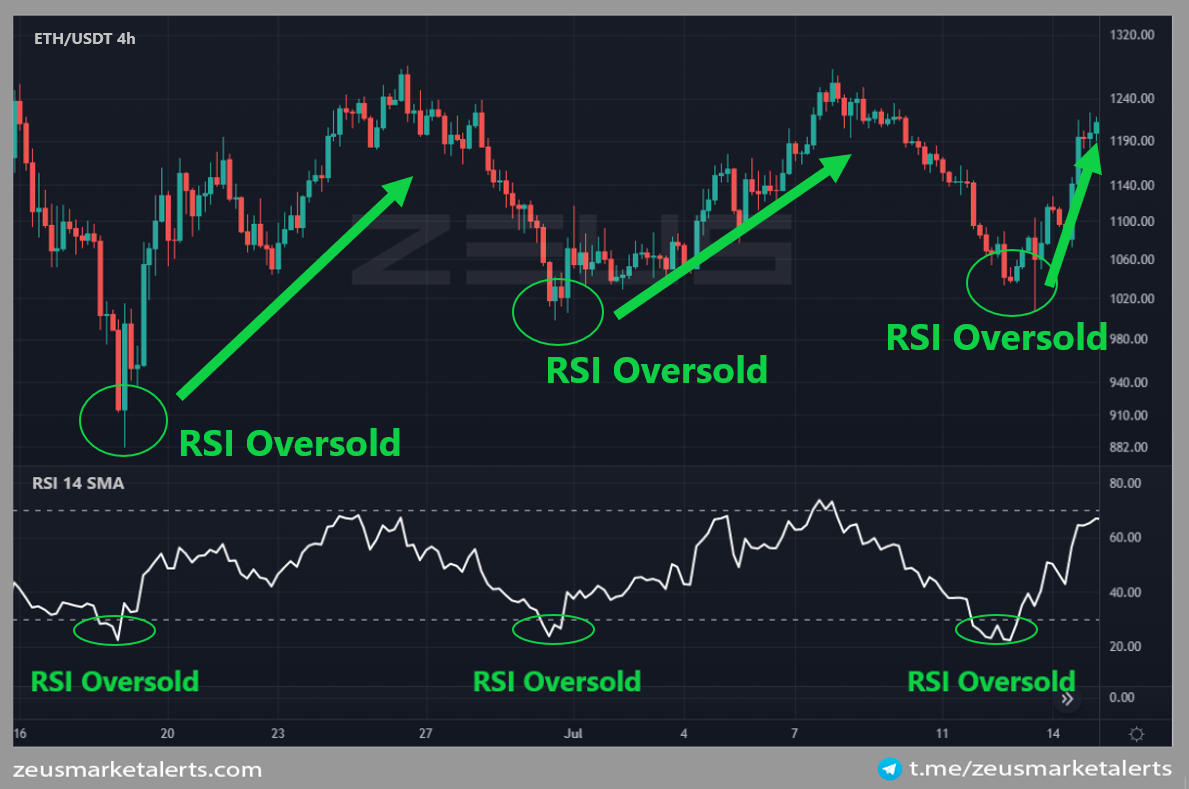
On the picture you can see how our Members received the alert to their private Telegram chat with ZEUS Bot showing reaction of the ETH after approaching oversold territory.
The price of a trading instrument is below its fair value and may be ready for a trend reversal, on an RSI chart it appears at 30 or below.
The higher the time frame you use the more accurate the RSI Oversold Indicator is. Ideally use 1h and higher time frames.
OUR TIP: before you enter the trade and to avoid false signals always check other indicators which confirm bullish market conditions or use our Trading Setups.
RSI Overbought
ZEUS will send you an alert describing market conditions.
The real example of Telegram message:
4h #BTC/USDT RSI Overbought
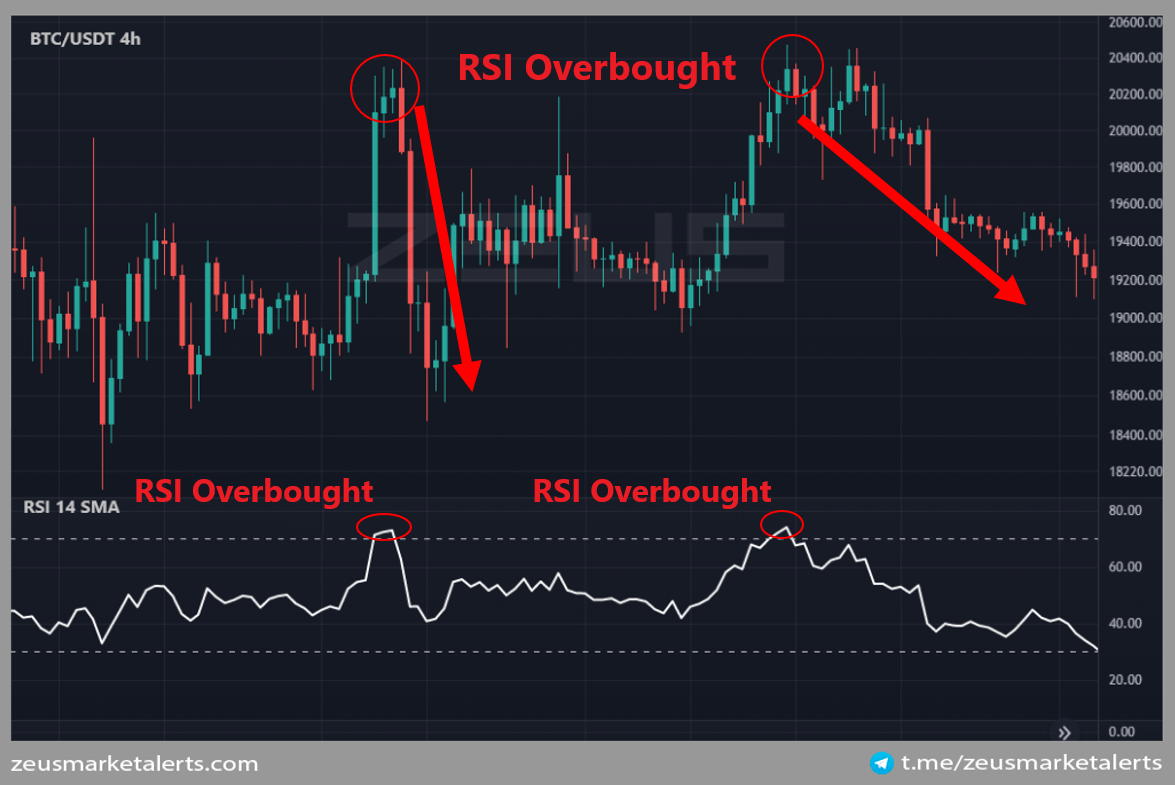
On the picture you can see how our Members received the alert to their private Telegram chat with ZEUS Bot showing reaction of the BTC after approaching overbought territory.
The price of a trading instrument is above its fair value and may be ready for a trend reversal, on an RSI chart it appears at 70 or above.
The higher the time frame you use the more accurate the RSI Overbought Indicator is. Ideally use 1h and higher time frames.
OUR TIP: before you enter the trade and to avoid false signals always check other indicators which confirm bullish market conditions or use our Trading Setups.
RSI Extremely Oversold
ZEUS will send you an alert describing market conditions.
The real example of Telegram message:
1h #AVAX/USDT RSI Extremely Oversold
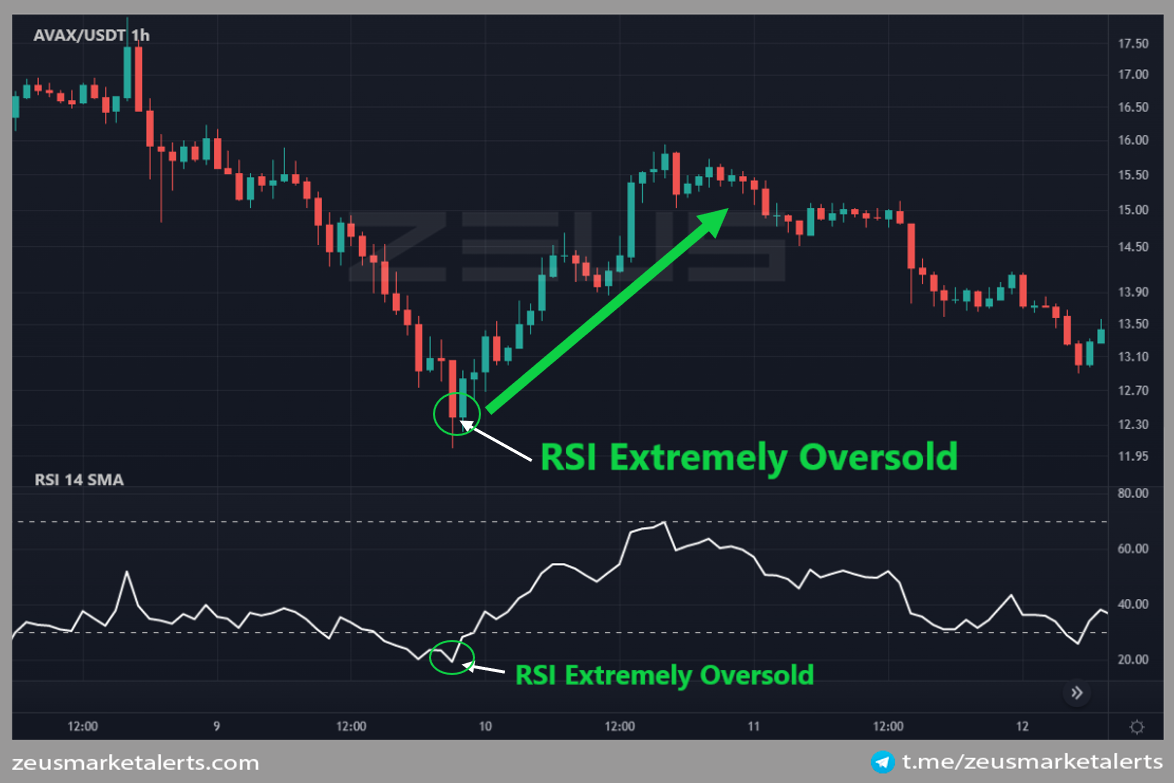
On the picture you can see how our Members received the alert to their private Telegram chat with ZEUS Bot showing reaction of the AVAX after approaching extremely oversold territory.
RSI Extremely Oversold signals an extreme situation and we could expect the market to change trend to go back up to higher levels, we consider RSI to be extremely oversold below 20
The higher the time frame you use the more accurate the RSI Extremely Overbought Indicator is. Ideally use 15m and higher time frames.
OUR TIP: before you enter the trade and to avoid false signals always check other indicators which confirm bullish market conditions or use our Trading Setups.
RSI Extremely Overbought
ZEUS will send you an alert describing market conditions.
The real example of Telegram message:
1h #HNT/USDT RSI Extremely Overbought
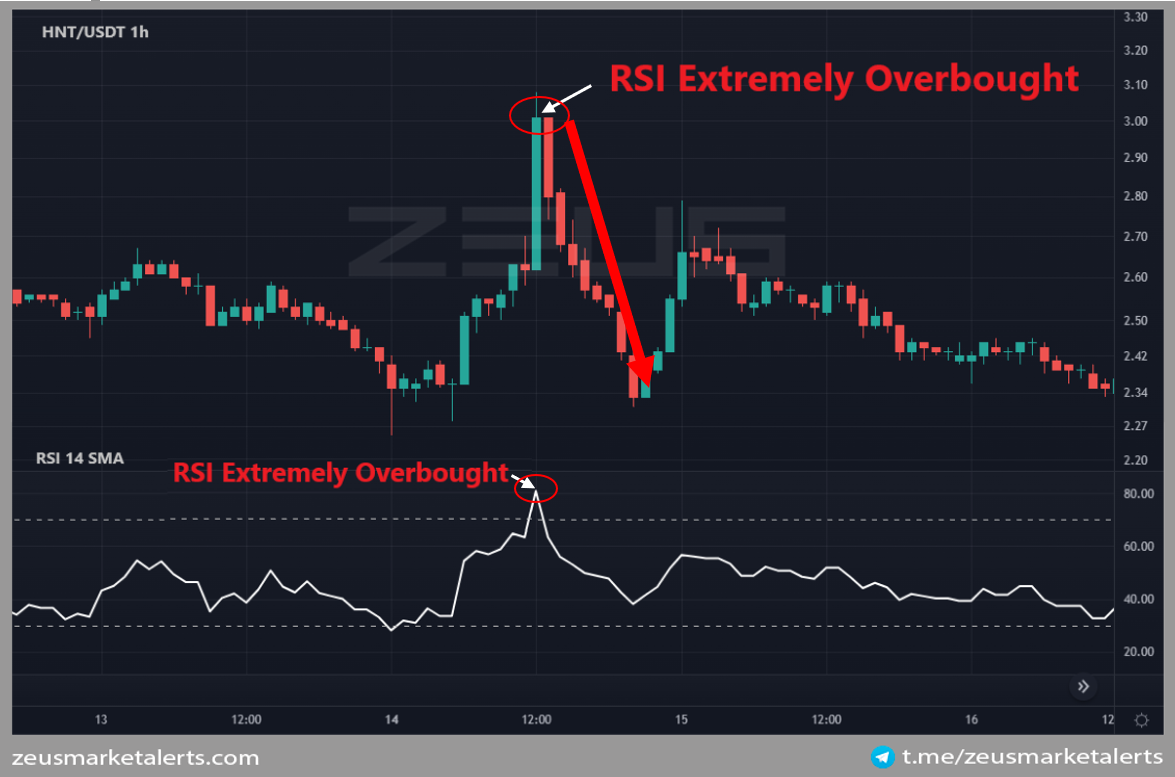
On the picture you can see how our Members received the alert to their private Telegram chat with ZEUS Bot showing reaction of the HNT after approaching extremely overbought territory.
RSI Extremely Overbought signals an extreme situation and we could expect the market to change trend to cool down, we consider RSI to be extremely overbought over 80.
The higher the time frame you use the more accurate the RSI Extremely Overbought Indicator is. Ideally use 15m and higher time frames.
OUR TIP: before you enter the trade and to avoid false signals always check other indicators which confirm bullish market conditions or use our Trading Setups.
Stochastic RSI
Stochastic RSI is a momentum oscillator with the aim of Stochastic RSI is to generate more Overbought and Oversold signals than RSI. The most common setup is 14 time periods, with Overbought/Oversold levels at 80/20.
In this Stochastic indicator we look for the cross of 2 lines, K line and D line.
- The %K line is the “fast” stochastic and refers to the number of RSI periods used in the stochastic calculation.
- The %D line is the “slow” stochastic or “signal” line and is a moving average of %K.

We recognize following 4 STOCH RSI market conditions:
1. Oversold (Cross is <20)
The price of a trading instrument is below its fair value and may be ready for a trend reversal, on an Stoch RSI chart it appears at 20 or below
2. Extremely Oversold (Cross is <1 or both lines are 0)
It signals an extreme situation and we could expect the market to change trend and go back up to higher levels, we consider Stoch RSI Cross extremely oversold when it happens below 1
3. Overbought (Cross is > 80)
The price of a trading instrument is above its fair value and may be ready for a trend reversal, on an Stoch RSI chart the StochRSI Cross appears at 80 or above.
4. Extremely Overbought (Cross is > 99 or both lines are 100)
It signals an extreme situation and we could expect the market to change trend and cool down, we consider Stoch RSI Cross extremely overbought when it happens above 99
StochRSI Oversold
ZEUS will send you an alert describing market conditions.
The real example of Telegram message:
1h #ADA/USDT StochRSI Oversold

On the picture you can see how our Members received two alerts to their private Telegram chat with ZEUS Bot showing reaction of the ADA after approaching oversold territory.
The price of a trading instrument is below its fair value and may be ready for a trend reversal, on an StochRSI chart it appears at 20 or below.
OUR TIP: before you enter the trade and to avoid false signals always check other indicators which confirm bullish market conditions or use our Trading Setups.
StochRSI Overbought
ZEUS will send you an alert describing market conditions.
The real example of Telegram message:
1h #ETH/USDT StochRSI Overbought
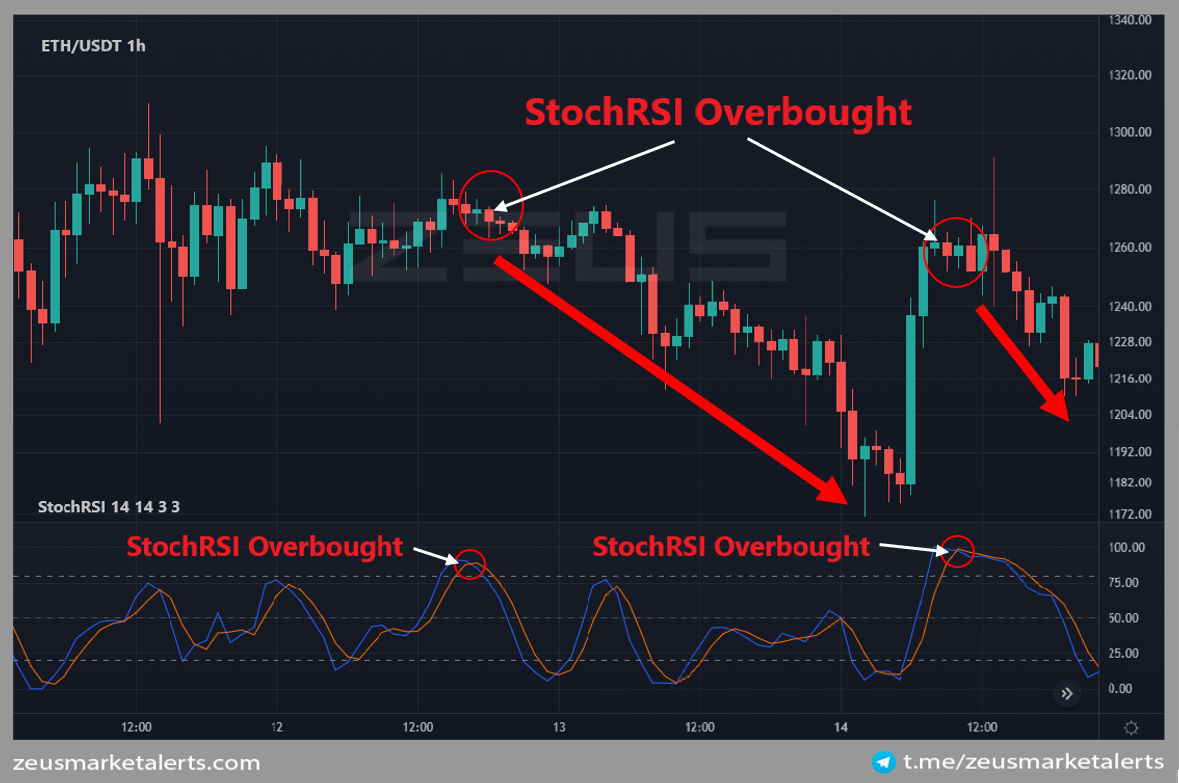
On the picture you can see how our Members received two alerts to their private Telegram chat with ZEUS Bot showing reaction of the ETH after approaching overbought territory.
The price of a trading instrument is above its fair value and may be ready for a trend reversal, on an StochRSI chart it appears at 80 or above.
OUR TIP: before you enter the trade and to avoid false signals always check other indicators which confirm bullish market conditions or use our Trading Setups.
StochRSI Extremely Oversold
ZEUS will send you an alert describing market conditions.
The real example of Telegram message:
4h #MATIC/USDT StochRSI Extremely Oversold

On the picture you can see how our Members received the alert to their private Telegram chat with ZEUS Bot showing reaction of the MATIC after approaching extremely oversold territory.
StochRSI Extremely Oversold signals an extreme situation and we could expect the market to change trend and go back up to higher levels, we consider Stoch RSI Cross extremely oversold when it happens below 1
OUR TIP: before you enter the trade and to avoid false signals always check other indicators which confirm bullish market conditions or use our Trading Setups.
StochRSI Extremely Overbought
ZEUS will send you an alert describing market conditions.
The real example of Telegram message:
4h #BTC/USDT StochRSI Extremely Oversold
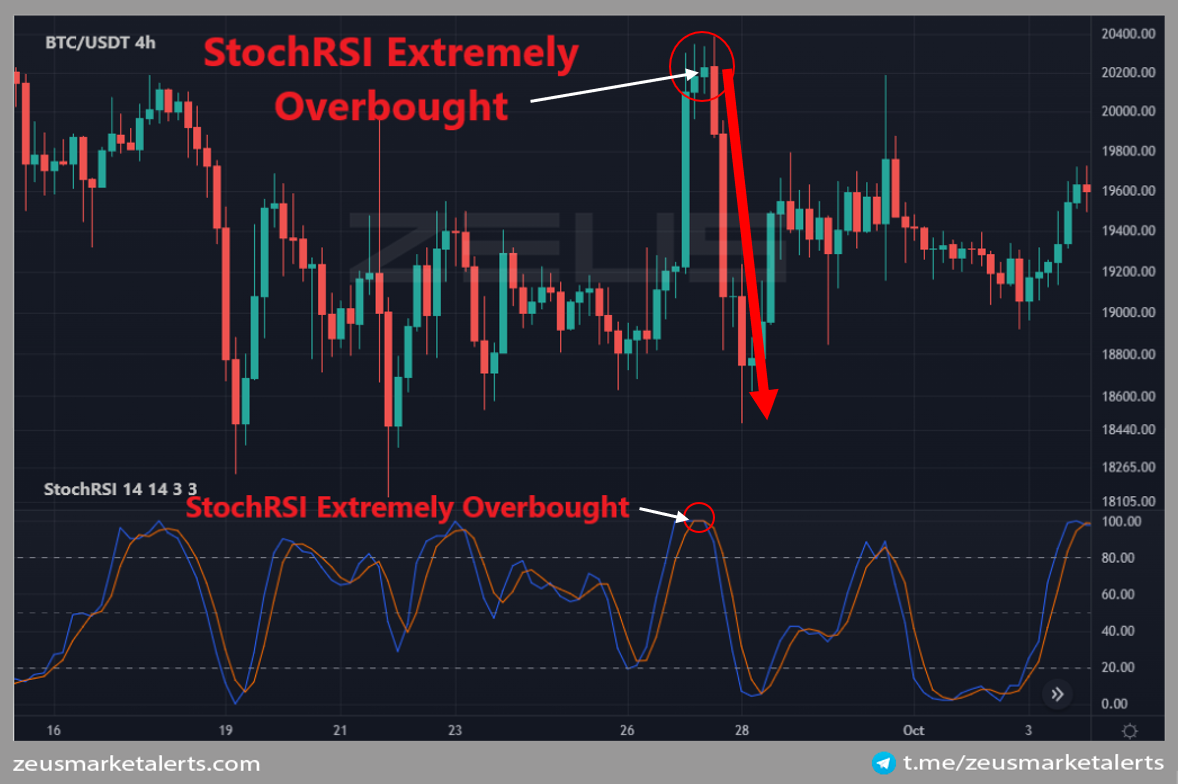
On the picture you can see how our Members received the alert to their private Telegram chat with ZEUS Bot showing reaction of the BTC after approaching extremely oversold territory.
StochRSI Extremely Overbought signals an extreme situation and we could expect the market to change trend and cool down, we consider Stoch RSI Cross extremely overbought when it happens above 99
OUR TIP: before you enter the trade and to avoid false signals always check other indicators which confirm bullish market conditions or use our Trading Setups.
Moving Average Convergence Divergence (MACD)
MACD trading indicator was created by Gerald Appel in tale 1970s. It reveals changes in momentum, direction and strength of a trend.
It works the best in trending market and is composed of 3 series which are:
- MACD line – is calculated as a difference between 12-period and 26-period EMAs of the price. It is displayed as a blue line.
- Signal line – is calculated as a 9 period EMA of the MACD. It is displayed as an orange line.
- Histogram – represents difference between MACD and Signal line. It oscillates around zero “0” horizontal line
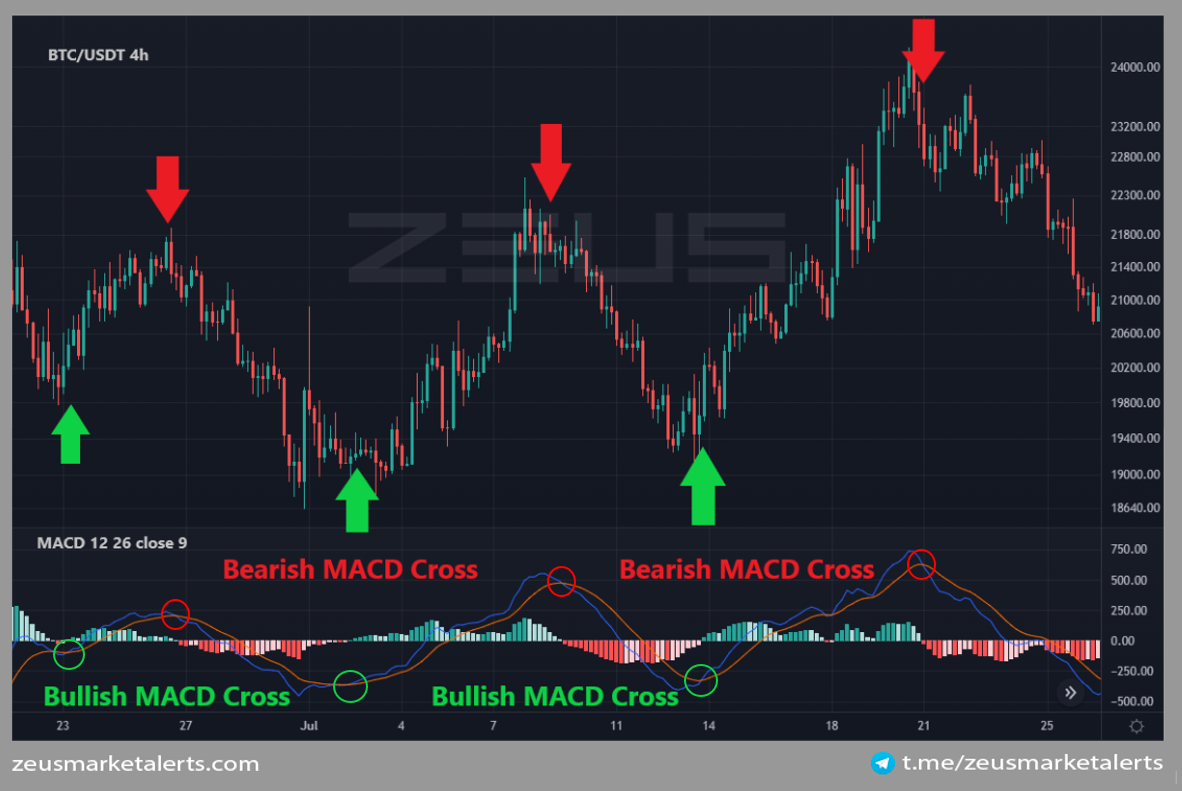
MACD identifies 2 trading situation which are defined by MACD Cross and those are Bullish MACD Cross and Bearish MACD Cross.
- Bullish MACD Cross – appears when MACD line (blue line) crosses Signal line (orange line) from downside and the cross happens under the Histogram line (bellow zero “0” line).
- Bearish MACD Cross – appears when MACD line (blue line) crosses Signal line (orange line) from upside and the cross happens above the Histogram line (bellow zero “0” line).
Bullish MACD Cross
ZEUS will send you an alert describing market conditions.
The real example of Telegram message:
1h #LINK/USDT Bullish MACD Cross
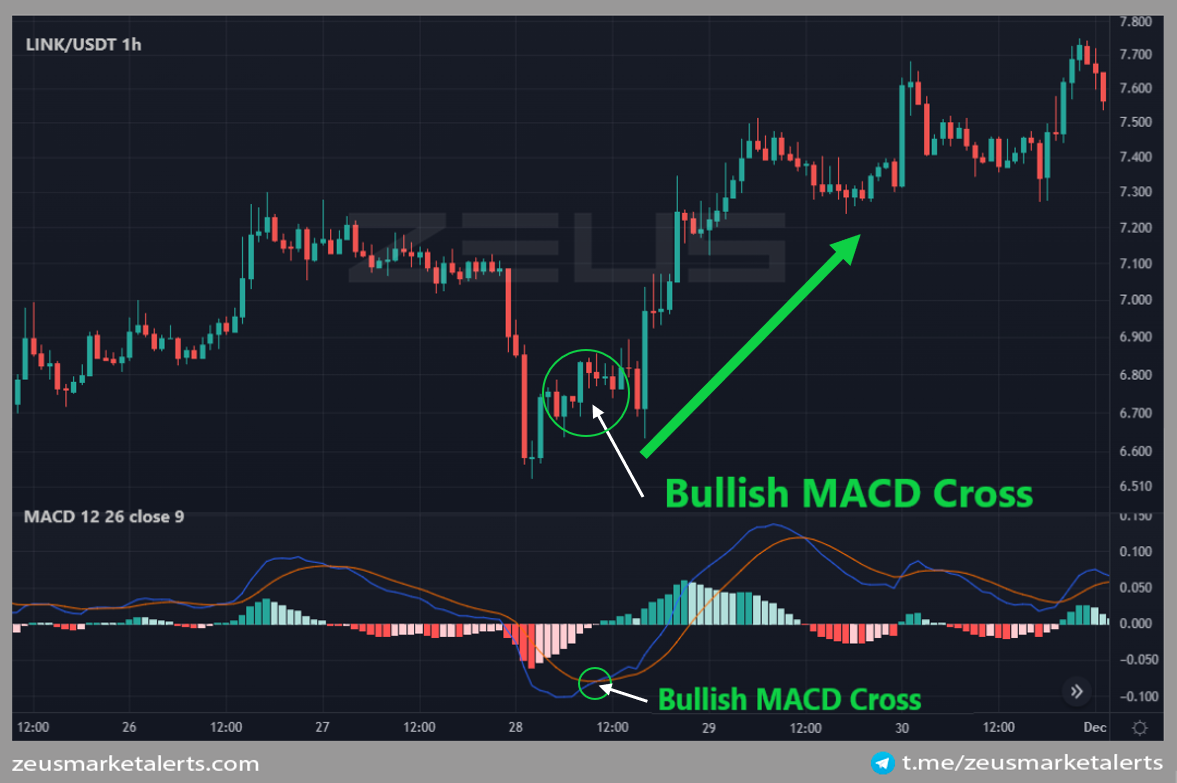
On the picture you can see how our Members received the alert to their private Telegram chat with ZEUS Bot showing reaction of the LINK after Bullish MACD Cross occurred.
OUR TIP: before you enter the trade and to avoid false signals always check other indicators which confirm bullish market conditions or use our MACD Setup.
Bearish MACD Cross
ZEUS will send you an alert describing market conditions.
The real example of Telegram message:
1h #MATIC/USDT Bearish MACD Cross
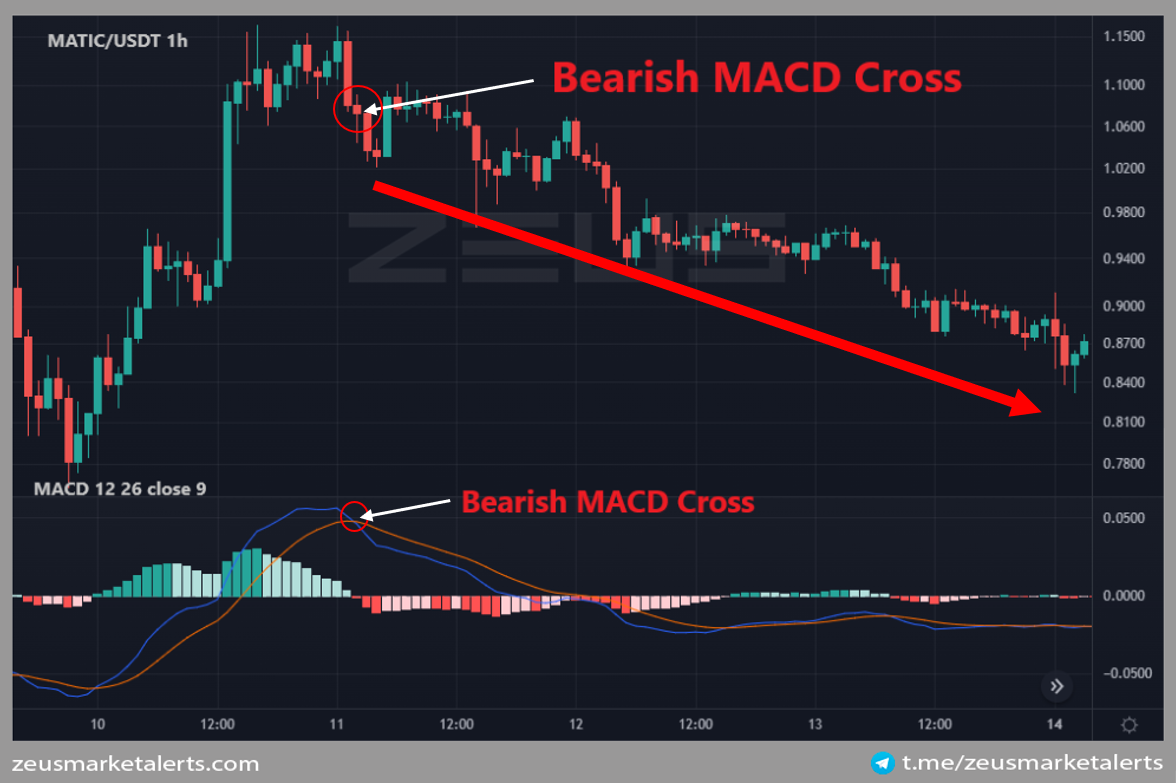
On the picture you can see how our Members received the alert to their private Telegram chat with ZEUS Bot showing reaction of the MATIC after Bearish MACD Cross occurred.
OUR TIP: before you enter the trade and to avoid false signals always check other indicators which confirm bearish market conditions or use our MACD Setup.